Market Crash Alert? Understanding Global Volatility, Rising Oil Prices & Safe-Haven Trading
$7 trillion wiped from global stocks, oil prices surging, and recession fears mounting — discover what's really driving the 2026 market chaos and how smart traders are responding with safe-haven strategies.
Introduction: When the Markets Start Screaming — Are You Listening?
Imagine waking up one morning to find that $7 trillion in global wealth has simply... vanished. Not stolen. Not hidden. Just erased — in a matter of weeks — from stock portfolios, retirement funds, and investment accounts across the world.
That's not a hypothetical. That's 2026.
Right now, global financial markets are experiencing some of the most turbulent conditions seen in years. From escalating geopolitical conflicts in the Middle East to central banks wrestling with stubborn inflation, from OPEC slashing oil supply to whispers of a full-blown global recession — every headline seems to carry a new warning sign.
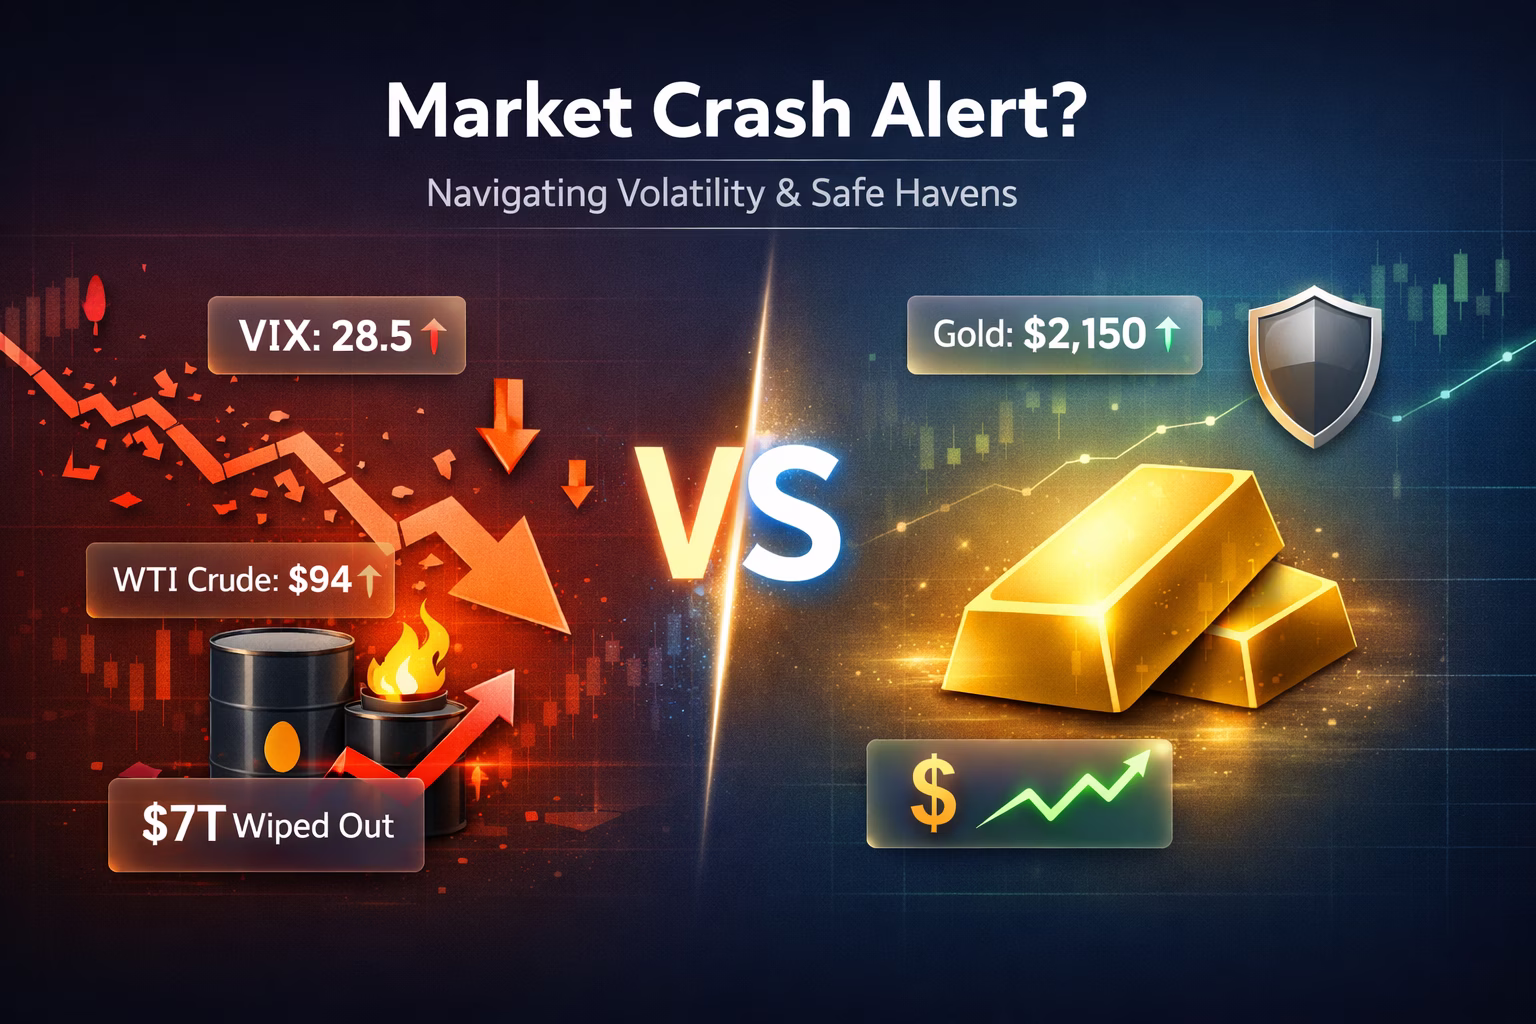
Oil prices are surging. The VIX — Wall Street's famous "fear gauge" — is spiking. Investors are fleeing risky assets and rushing toward gold, the US dollar, and government bonds. And across trading floors from London to New York to Dubai, one question dominates every conversation:
Is this the beginning of a major market crash — or just another storm that will pass?
This blog post breaks it all down for you. Whether you're a seasoned trader, a retail investor, or someone simply trying to protect your savings, understanding what's driving this volatility is the first step toward making smarter financial decisions. Let's dive in.
Section 1: What Is Global Market Volatility — And Why Should You Care?
Defining Market Volatility
Market volatility refers to the rate at which the price of assets — stocks, commodities, currencies, bonds — rises or falls over a given period. High volatility means prices are swinging dramatically and unpredictably. Low volatility means markets are calm and relatively stable.
Volatility itself is not inherently bad. In fact, many professional traders thrive in volatile conditions because big price swings create big opportunities. But for everyday investors — especially those with long-term portfolios — extreme volatility can be deeply unsettling and financially damaging.
The VIX Index: Wall Street's Fear Gauge
One of the most important tools for measuring volatility is the VIX Index — officially known as the CBOE Volatility Index. Often called the "fear gauge" of financial markets, the VIX measures how much uncertainty or fear exists among investors by tracking expected volatility in the S&P 500 over the next 30 days.
Here's a simple breakdown of what VIX levels mean:

- VIX below 15 — Markets are calm. Investors feel confident.
- VIX between 15–25 — Moderate uncertainty. Caution is advised.
- VIX between 25–35 — High volatility. Fear is rising.
- VIX above 35 — Extreme fear. Markets are in panic mode.
In early 2026, the VIX has surged well above the 25 threshold — signaling that institutional investors are deeply concerned about what lies ahead.
What's Causing the Volatility in 2026?
Several powerful forces have collided simultaneously to create this perfect storm of market instability:
Geopolitical Tensions: Armed conflicts, trade wars, and diplomatic breakdowns are rattling investor confidence globally. When the world feels unstable, markets react with fear.
Rising Oil Prices: Crude oil — the lifeblood of the global economy — has surged dramatically, driving up inflation and squeezing corporate profit margins worldwide.
Stubborn Inflation: Despite aggressive interest rate hikes by central banks over the past two years, inflation remains elevated in many economies, leaving policymakers with very limited tools.
Central Bank Policy Uncertainty: Investors are unsure whether the US Federal Reserve, European Central Bank, and other major central banks will cut rates, hold them, or raise them further — creating a fog of uncertainty that markets hate.
Slowing Economic Growth: Multiple major economies are showing signs of serious slowdown, with GDP growth forecasts being revised downward across the board.

The combination of these factors has led to dramatic sell-offs in global equity markets, with major indices like the S&P 500, FTSE 100, Nikkei 225, and European markets all posting significant losses in recent weeks.
Section 2: Geopolitical Factors Driving Market Instability
The Middle East: Ground Zero for Market Anxiety
Few regions on earth have more power to move global financial markets than the Middle East — and for one critical reason: oil.
The ongoing conflict in the Middle East has created massive uncertainty around energy supply chains. When military tensions escalate in or near major oil-producing nations, markets immediately price in the risk of supply disruption. Traders don't wait for disruptions to actually happen — they react to the possibility alone.
This creates a vicious cycle:
- Conflict escalates in oil-rich regions.
- Oil traders bid prices up on supply fears.
- Higher oil prices fuel inflation.
- Inflation forces central banks to keep rates high.
- High rates slow economic growth.
- Stock markets fall as corporate earnings expectations drop.
- Investor panic sets in — feeding further volatility.

This entire chain reaction has been playing out in real time in 2026, and the consequences are being felt in every corner of the global financial system.
Beyond the Middle East: A World Under Political Pressure
The Middle East conflict is not the only geopolitical flashpoint driving market instability in 2026. Other major tensions include:
US-China Trade Relations: Ongoing disputes over tariffs, technology exports, and Taiwan continue to weigh on investor sentiment, particularly in tech-heavy markets.
European Energy Security: Europe continues to navigate the aftermath of its shift away from Russian energy, creating structural vulnerabilities in energy supply that keep European markets on edge.
Emerging Market Instability: Several emerging market economies are experiencing currency crises, sovereign debt pressures, and political instability that is causing capital flight — with investors pulling money out and moving it to perceived safe havens.
Political Uncertainty in Major Democracies: Election cycles, government transitions, and policy reversals in key economies are adding another layer of unpredictability to an already fragile global environment.
The collective weight of these political pressures is crushing investor confidence — and markets reflect sentiment just as much as they reflect economic fundamentals.
How Political Uncertainty Translates to Market Volatility
Investor confidence is built on predictability. When businesses can anticipate policy environments, regulatory frameworks, and supply chain stability, they plan, invest, and grow. When those predictions become impossible, companies cut spending, delay investments, and hoard cash. This contraction ripples through the entire economy — reducing earnings, GDP growth, and ultimately, stock valuations.
In short: political chaos is financial chaos. And right now, we have plenty of both.
Section 3: Rising Oil Prices — Cause, Effect, and Trading Opportunity
Why Are Oil Prices Surging?
Crude oil prices in 2026 have climbed sharply, catching many analysts off guard. Several factors are driving this surge:
OPEC+ Production Cuts: The Organization of the Petroleum Exporting Countries and its allies (collectively OPEC+) have maintained aggressive production cut agreements, deliberately restricting global oil supply to prop up prices. Saudi Arabia and Russia — the two dominant players — have shown no signs of reversing these cuts.
Geopolitical Supply Risks: Conflict in the Middle East creates ongoing risk of physical disruption to oil production and transportation through critical chokepoints like the Strait of Hormuz — through which roughly 20% of global oil trade passes.
Rising Global Demand: Despite economic headwinds in developed markets, energy demand from Asia — particularly India and Southeast Asia — continues to grow robustly, tightening the supply-demand balance.
US Dollar Dynamics: Because oil is priced in US dollars globally, any weakening of the dollar can push oil prices higher in dollar terms. Currency fluctuations have added additional upward pressure on crude prices in 2026.
Declining US Shale Growth: US shale oil production — which helped keep global prices in check for a decade — is growing more slowly than expected in 2026 due to capital constraints and declining well productivity in mature fields.
Oil Price Comparison: Recent Trend
Here is a simplified view of how crude oil prices (Brent Crude) have moved in the early months of 2026:
| Month | Brent Crude Price (Per Barrel) | Change |
|---|---|---|
| January 2026 | $78 | Baseline |
| February 2026 | $84 | +7.7% |
| March 2026 | $91 | +8.3% |
| April 2026 (est.) | $95–$100 | +4.5% to +9.9% |

This near-30% increase since the start of the year is not a minor fluctuation — it represents a major structural shift in energy markets with profound implications for inflation and economic growth.
The Economic Ripple Effect of Rising Oil Prices
Higher oil prices don't just affect fuel costs at the gas station. Their impact spreads through the entire economy like a shockwave:

Inflation Acceleration: Energy costs are embedded in the production of almost every good and service. When oil prices rise, transportation costs increase, manufacturing becomes more expensive, and these costs are passed on to consumers — fueling broader inflation.
Corporate Margin Compression: Airlines, logistics companies, manufacturers, and retailers all see their operating costs rise sharply when oil prices surge. This squeezes profit margins and often leads to downward revisions in earnings forecasts — which tanks stock prices.
Consumer Spending Reduction: When households spend more on fuel and energy, they have less disposable income for other purchases. This reduction in consumer spending drags on GDP growth.
Central Bank Dilemma: Rising oil-driven inflation forces central banks to keep interest rates high — which slows economic growth and increases the risk of recession. It's a trap with no easy exit.
Oil as a Trading Opportunity
While rising oil prices create economic pain for most people, they also create trading opportunities for those who understand the market dynamics:
Going Long on Oil: Traders who correctly anticipate continued supply constraints and geopolitical risk can profit from rising oil prices through crude oil futures, ETFs like USO, or energy sector stocks.
Energy Sector Equities: Oil majors like ExxonMobil, Shell, BP, and Saudi Aramco tend to benefit from higher crude prices. Their revenues surge when oil is expensive.
Shorting Vulnerable Sectors: Airlines, shipping companies, and consumer goods manufacturers are particularly hurt by high oil prices. Informed short sellers can profit from their declining share prices.
Currency Plays: Petrocurrencies like the Canadian dollar (CAD) and Norwegian krone (NOK) tend to strengthen when oil prices rise. Forex traders can capitalize on these correlations.
However — and this is critical — trading oil in a volatile geopolitical environment carries substantial risk. Prices can reverse sharply and suddenly when diplomatic breakthroughs occur or when OPEC surprises the market with policy changes. Always trade with proper risk management in place.
Section 4: Recession and Stagflation Fears — The Nightmare Scenario
What Is a Recession?
A recession is technically defined as two consecutive quarters of negative GDP growth. But the human experience of a recession is far broader: rising unemployment, declining business investment, falling consumer confidence, and widespread financial stress.
Recessions are painful but recoverable. What makes the current environment particularly dangerous is the possibility of something worse: stagflation.
What Is Stagflation — And Why Is It So Dangerous?

Stagflation is the toxic combination of stagnant economic growth and high inflation occurring simultaneously. It's particularly dangerous because the traditional tools used to fight each problem make the other problem worse:
- To fight inflation, central banks raise interest rates — but this slows economic growth further.
- To stimulate growth, central banks cut interest rates — but this fuels inflation further.
You're essentially stuck between two fires with no safe path forward. The last major stagflationary episode was in the 1970s, triggered by the OPEC oil embargo — and it caused years of economic hardship across the developed world.
Sound familiar? Rising oil prices driven by geopolitical conflict, persistent inflation, and slowing growth. The parallels to 2026 are deeply uncomfortable.
The Impact on Different Asset Classes

Stocks: In a recessionary or stagflationary environment, equities generally suffer. Corporate earnings fall as costs rise and consumer demand drops. High-growth, high-valuation stocks tend to be hit hardest as interest rates remain elevated.
Bonds: Government bonds become more attractive as investors seek safety, but bond prices are also suppressed by persistent inflation and high interest rates. The relationship between bonds and the economic environment becomes complex and unpredictable.
Real Estate: Rising interest rates increase mortgage costs, cooling housing demand and prices. Commercial real estate faces additional pressure from economic slowdown.
Cash: In inflationary environments, cash loses purchasing power steadily — but in a high-rate environment, money market funds and short-duration instruments offer attractive yields as a temporary parking spot.
Commodities: Historically, commodities — including oil, gold, and agricultural products — tend to hold value or rise during inflationary periods, making them attractive in stagflationary scenarios.
Are We Already in a Recession?
The honest answer: possibly. Several major economies are flirting with contraction. Germany has already reported negative growth. Japan's recovery is stalling. China's post-pandemic rebound has disappointed. The United States, while still technically growing, is showing clear signs of slowdown in manufacturing, housing, and consumer spending.
The word "recession" may not appear in official government statistics yet — but the conditions on the ground increasingly match the experience of one.
Section 5: Safe-Haven Trading — Where Smart Money Goes During Chaos
What Are Safe-Haven Assets?
Safe-haven assets are financial instruments that tend to retain or increase in value during periods of market stress, geopolitical uncertainty, and economic turbulence. When fear grips the market, investors don't just sell — they reallocate. And they typically move their money into a handful of historically reliable safe havens.
The most important safe-haven assets to understand are:

Gold: The oldest and most universal store of value in human history. Gold has no counterparty risk, is not issued by any government, and has maintained purchasing power across centuries. During market crises, gold typically surges as investors flee paper assets.
US Dollar (USD): Despite America's own economic challenges, the US dollar remains the world's reserve currency. In times of global stress, demand for dollars increases as international investors seek liquidity and stability.
US Treasury Bonds: US government bonds — particularly short-term T-bills and long-term 10-year and 30-year Treasuries — are considered among the safest assets in the world. When equity markets fall, bond prices typically rise as demand surges.
Japanese Yen (JPY): The yen has a long history of strengthening during global risk-off events, partly because Japan is a major creditor nation and partly due to the unwinding of yen-funded carry trades.
Swiss Franc (CHF): Switzerland's political neutrality, economic stability, and strong financial system make the Swiss franc a reliable safe-haven currency during periods of geopolitical tension.
Why Do Traders Flock to Safe-Haven Assets?
The psychology is straightforward: when the future is uncertain and risky assets are selling off, capital preservation becomes the priority. A trader or investor who moves to gold or US Treasuries may not make huge gains — but they are protecting themselves from catastrophic losses while waiting for clarity.
This behavior is rational and historically consistent. During the 2008 financial crisis, gold surged dramatically while equity markets crashed. During the COVID-19 market panic of early 2020, the US dollar initially surged, and gold followed strongly throughout the year.
In 2026, we are seeing this pattern repeat:
- Gold has pushed toward and beyond key resistance levels as demand from central banks and institutional investors accelerates.
- The US Dollar Index (DXY) has remained elevated as global investors seek dollar-denominated safety.
- US Treasury yields have been volatile but Treasury bonds remain in demand during equity sell-off episodes.
Short-Term vs Long-Term Safe-Haven Strategies

For Short-Term Traders: Safe-haven assets like gold and the USD can provide excellent short-term trading opportunities during volatile periods. Breakouts in gold above key resistance levels, or USD strength plays against weaker currencies, can offer favorable risk-reward setups. However, safe-haven assets can reverse sharply when risk sentiment improves — so tight stop-losses and active position management are essential.
For Long-Term Investors: A permanent allocation to gold (typically 5–15% of a portfolio) provides structural protection against inflation and crisis events. Long-term Treasury bonds can also serve as portfolio ballast — though in a stagflationary environment, this relationship becomes less reliable than historical patterns suggest.
Section 6: How Traders Can Navigate Current Market Conditions
 Essential Tools for Tracking Market Volatility in 2026
Tip 1: Reduce Position Size — Respect the Volatility
The single most important risk management adjustment in a volatile market is reducing position size. When price swings are larger and faster than normal, your standard position size can expose you to outsized losses. Cutting position size in half — or even more — allows you to stay in the market and take advantage of opportunities without risking devastating drawdowns.
Tip 2: Use Stop-Loss Orders Religiously
In a volatile market, the difference between a manageable loss and an account-destroying loss is often a well-placed stop-loss order. Set your stops before entering every trade. Never move a stop in the direction of a losing trade. And remember — in fast-moving, gapping markets, your actual fill price may be worse than your stop level, so factor in slippage.
Tip 3: Diversify Across Asset Classes — Not Just Stocks
True diversification means spreading your exposure across assets that do not move in the same direction at the same time. In a correlated sell-off — where stocks, bonds, and crypto all fall together — traditional diversification fails. Consider including:
- Physical gold or gold ETFs
- Energy sector equities (which benefit from rising oil)
- Short-duration government bonds or money market funds
- Currency positions in safe-haven FX pairs
- Real assets like commodities or commodity-linked equities
Tip 4: Trade the Range — Avoid Chasing Breakouts
In volatile, news-driven markets, price often whipsaws violently in both directions without establishing a clear directional trend. Chasing breakouts in these conditions frequently leads to getting stopped out at the top or bottom of a move. Range-trading strategies — identifying key support and resistance levels and trading between them — can be more effective until a clear trend emerges.
Tip 5: Stay Informed — But Don't Overtrade
Information overload is real during market crises. Every hour brings a new headline, a new data point, a new analyst opinion. The temptation to constantly react to every piece of news leads to overtrading — which increases transaction costs and emotional decision-making. Develop a disciplined trading plan, identify your key levels and triggers in advance, and stick to them.
Essential Tools for Tracking Market Volatility in 2026
Tip 6: Consider Hedging Your Portfolio
If you hold a substantial long equity portfolio, consider hedging strategies to protect against further downside:
- Buying put options on major indices like the S&P 500 or Nasdaq.
- Taking long gold positions to offset equity losses.
- Adding inverse ETFs for short-term hedging (use with caution — these decay over time).
- Reducing equity exposure and increasing cash or short-duration bond allocation.
Hedging costs money — it reduces your upside when markets recover. But in environments like this, the cost of not hedging can be far greater.
Section 7: Key Takeaways and Conclusion
Let's bring it all together. Here's what every trader and investor needs to understand about the current global market environment:

The volatility is real and multi-layered. This is not a simple market correction driven by a single factor. It is the result of several powerful forces converging simultaneously: geopolitical conflicts, energy supply disruptions, persistent inflation, central bank policy uncertainty, and slowing global growth. Understanding each of these layers is essential for making sense of market behavior.
Oil is the central nervous system of this crisis. Rising crude oil prices are the thread connecting geopolitical tension, inflation, recession risk, and market volatility. Watch oil prices closely — they are both a symptom and a cause of the current instability.
Safe-haven assets are not just for crisis mode — they are strategic tools. Gold, the US dollar, and Treasury bonds serve important functions in a well-managed portfolio, not just during crises but as structural hedges against the kind of uncertainty we are living through right now.
Risk management is not optional — it's survival. In markets like these, preserving capital is more important than chasing returns. The traders and investors who survive volatile markets are those who manage risk first and seek profits second.
Opportunity exists — but so does danger. Volatile markets create enormous trading opportunities in oil, gold, currencies, and even beaten-down equities. But these opportunities must be approached with discipline, reduced position sizing, and rigorous risk management.
The $7 trillion wiped from global stock markets is a stark reminder that financial markets can destroy wealth as quickly as they create it. The traders and investors who thrive in this environment are not the ones who panic — they are the ones who prepare, adapt, and stay informed.
Stay informed. Monitor the markets daily. Build a disciplined trading plan. Protect your capital above all else — and then position yourself to profit when the dust begins to settle.
The storm is here. How you navigate it is entirely up to you.
Frequently Asked Questions (FAQ)

Q: What caused the $7 trillion global market loss?
A: The $7 trillion loss in global equity markets is the result of multiple converging factors: rising oil prices driven by OPEC+ production cuts and Middle East conflict, persistent inflation that is forcing central banks to maintain high interest rates, slowing economic growth in major economies, and a broad collapse in investor confidence driven by geopolitical uncertainty. No single cause — but all of these forces working together simultaneously.
Q: Which assets are safest during a market crash?
A: Historically, the most reliable safe-haven assets during market crashes include gold, US Treasury bonds (particularly short-term T-bills), the US dollar, the Japanese yen, and the Swiss franc. Physical commodities like oil can also perform well during supply-driven crises, though they carry their own volatility. The key is diversification across uncorrelated assets rather than concentration in any single safe haven.
Q: Is this the start of a global recession?
A: Several major economies are already showing recessionary characteristics — including Germany, Japan, and parts of Asia. The United States and UK are slowing significantly. Whether this becomes a formally declared global recession depends on how long oil prices remain elevated, whether central banks begin cutting rates, and whether geopolitical tensions de-escalate. The risk is real and rising — but a recession is not yet the base case for most major forecasters.
Q: Should I sell all my stocks right now?
A: This is not financial advice — but from a strategic perspective, panic selling at market lows is historically one of the most costly mistakes investors make. A better approach is to review your portfolio, reduce exposure to the highest-risk assets, increase allocation to safer instruments, and ensure your position sizes reflect the current level of market risk. Wholesale liquidation often locks in losses right before a recovery.
Q: How long does market volatility typically last during geopolitical crises?
A: It varies significantly. Geopolitical volatility events can last anywhere from days to years depending on the nature of the conflict and its impact on economic fundamentals. The COVID-19 crash of March 2020 saw the S&P 500 recover its losses within six months. The 2008 financial crisis took years to fully recover. The current environment — combining geopolitical conflict with structural economic challenges — suggests volatility is likely to remain elevated for the foreseeable future rather than resolving quickly.
Q: What is the best trading strategy during high volatility?
A: During high volatility periods, experienced traders typically focus on: reducing position sizes, tightening stop-loss levels, trading shorter timeframes to reduce overnight risk exposure, focusing on assets with clear directional momentum (rather than sideways choppy markets), and increasing allocation to safe-haven assets. Risk management becomes the primary focus — profits follow when risk is properly controlled.
Disclaimer: This blog post is for educational and informational purposes only and does not constitute financial or investment advice. Trading and investing involve substantial risk of loss. Always conduct your own research and consult a qualified financial professional before making investment decisions.